

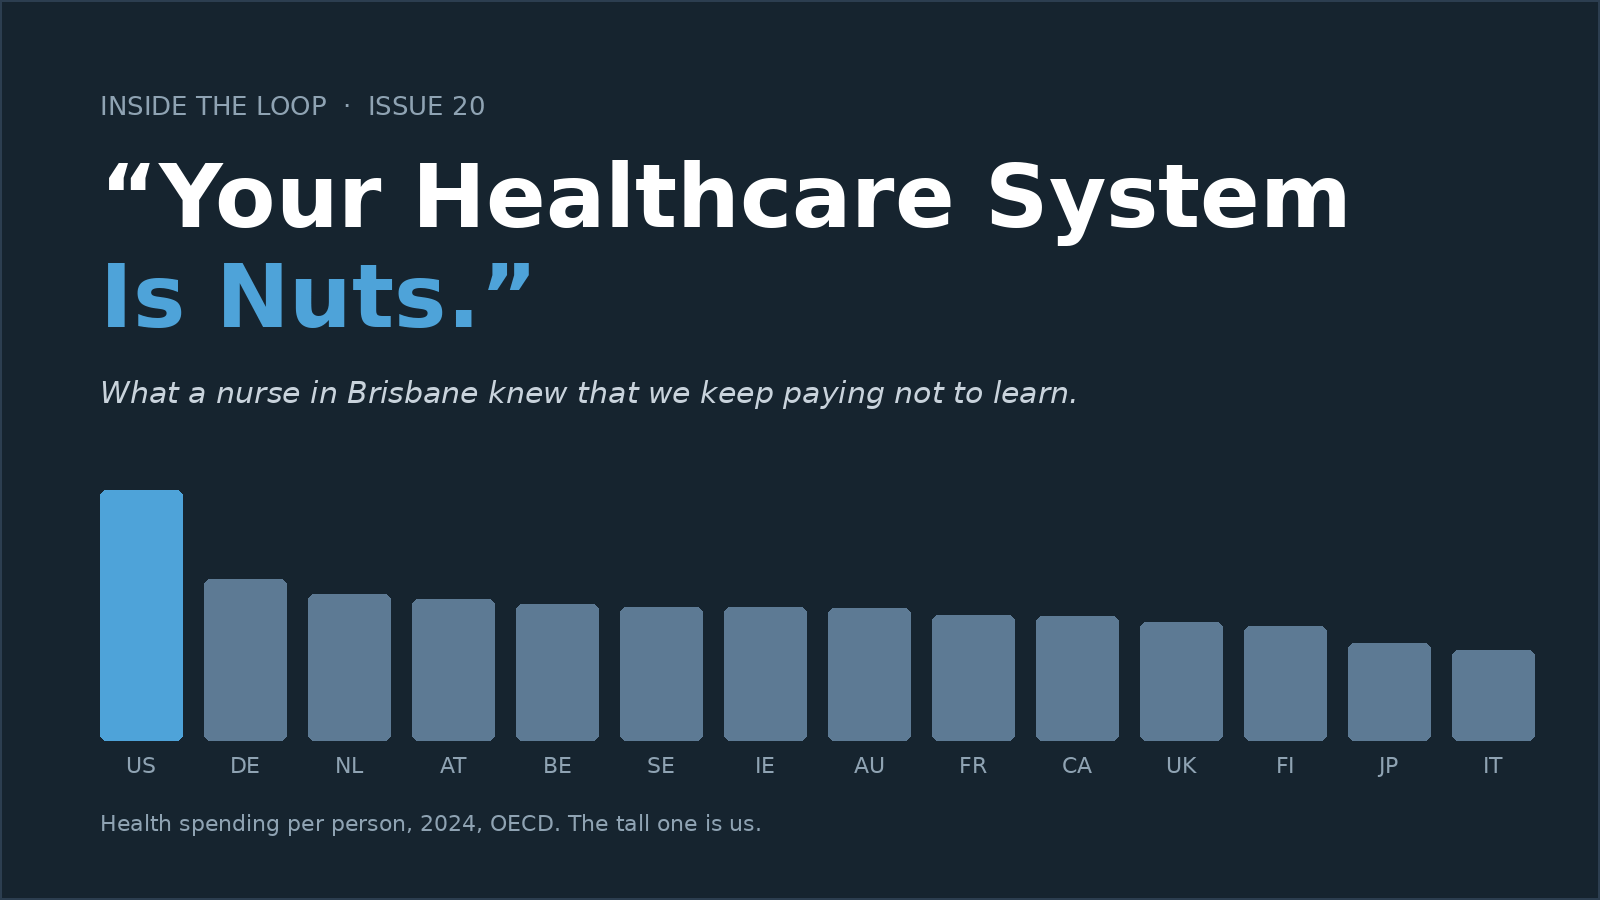
She said it standing next to a pump I had just finished demonstrating, in a critical care unit in Brisbane. “We love the technology from the U.S., but we think your healthcare system is nuts. How a modern country like the U.S. does not see a person’s right to healthcare is simply nuts to us.” She was not being unkind. She was being Australian, which means she said the quiet part in a normal speaking voice and went back to work.
I laughed. Then I flew home. It took me the better part of twenty years to notice that she had described, from memory and in two sentences, a table it has just taken me a week to build.
Fourteen countries, one narrow vantage point
Over forty years I was inside hospitals in fourteen countries: the United States, Japan, Australia, Canada, Ireland, the United Kingdom, Sweden, the Netherlands, Germany, Austria, France, Italy, Belgium and Finland. Some for a day, some for months. I was there because a sale had reached the point where somebody on the hospital side wanted to talk to the person who understood the network, the interfaces, and what was going to happen to their data. Most of that time was spent in critical care and the operating room. I was not around for admissions or discharges, and I am not going to say I know how those went.
What I do know is what the room looked like when a hospital decided whether to let my equipment in. I will come back to that, because it turned out to be the most surprising thing in the whole exercise.
This issue follows Issue 04, “We Broke It. We Know It. And We Keep Paying for It Anyway.” Same subject, different method. That one set the United States against the average. This one asks the same four questions of every country I stood in: what it costs, whether you have a right to it, how good it is, and what comes out the other end. The US goes last each time, so you have the comparison in hand before the home team comes up.
Three things’ Americans get wrong about everyone else
The picture most of us carry is that every other rich country runs one tax-funded system, with private insurance as a luxury on top. It is about two-thirds right, and the other third is where the argument lives.
Not all of them are tax funded. Germany, Austria, Belgium and, in large part, France run on compulsory contributions to sickness funds, not general taxation. Japan is statutory insurance too, employer-based or municipal, with 30 percent coinsurance and a monthly cap. The Netherlands has no public insurer at all: every resident must buy a policy from a private insurer, at a premium that cannot vary with health, plus an income-related contribution. [1] The honest sentence is “every country but the US guarantees enrollment,” not “every country but the US pays through taxes.”
Private insurance is four different products. In Canada it is barred from covering anything the public plan covers. In France it is nearly universal, 96 percent, and pays the co-pays; in Japan 95 percent of households hold a supplement. In Ireland (46 percent), Australia (45 percent with hospital cover), Austria (about four in ten) and the UK (12 percent) it buys a faster or more private route to the same care. In Germany, 11 percent of the population has opted out of the public system entirely. [1]
The United States is not the private outlier it looks like. Federal, state and local government sponsor 47 percent of US health spending. [2] In the OECD accounts, US government and compulsory spending came to $12,324 per person in 2024, which is more than the total spending per person, public and private together, of every other country on this list. [3] The American taxpayer already funds the most expensive public health system in the world. The private system sits on top of it.
On “right versus privilege,” the legal picture is narrower than the slogan. Of these fourteen, Italy, Finland and Japan put a right to health in the constitution. Sweden puts it in statute, England in the NHS Constitution, France in an entitlement called PUMa, the Netherlands in a legal duty to insure, Canada in the conditions attached to federal money. [4] Austria has no explicit constitutional right at all; a Vienna constitutional lawyer says so in as many words, and the system covers 99.9 percent of the population anyway. [5] The United States has no general right to coverage. It has EMTALA, a legal right to emergency stabilization regardless of ability to pay, [6] which explains a great deal about where the American system spends its money. We guarantee the most expensive door in the building and nothing behind it.
Question one: what does it cost?
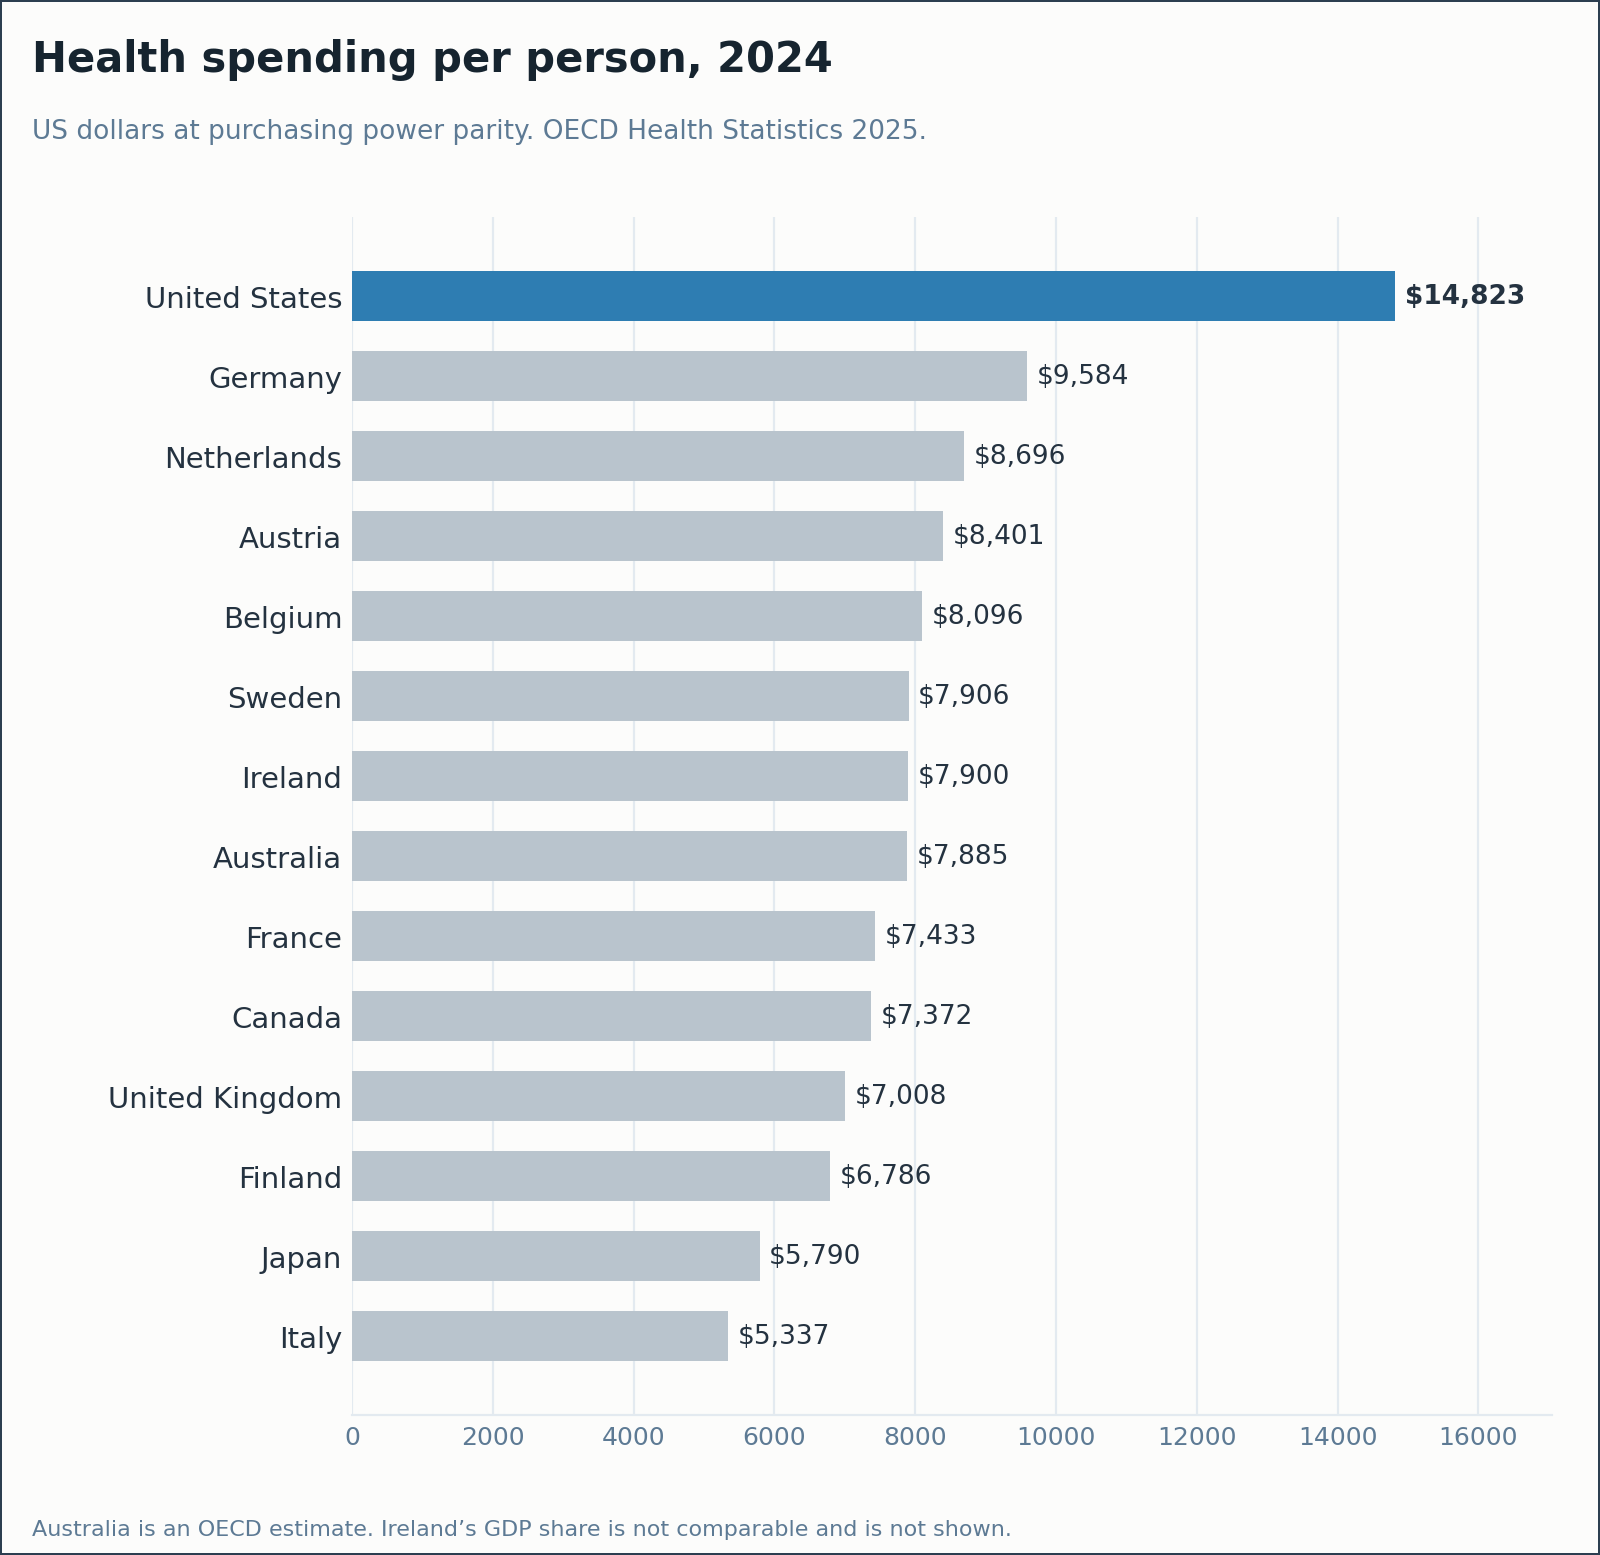
No suspense here. The United States spent $14,823 per person in 2024 on the OECD basis, or $15,474 on our own government’s count, 18 percent of everything the country produces. [3] [2] Germany is next at $9,584, and Germany has more hospital beds per person than any country on this list except Japan, and keeps people in them. Japan, with the longest-lived population on the list, spent $5,790. Italy, third longest-lived, spent $5,337. [3] Whatever we are buying with the extra six to nine thousand dollars a head, it is not years.
Question two: is it yours by right?
Thirteen of the fourteen answer yes, and they answer it before you get sick. Enrollment is automatic or compulsory, the insurer must take you, and the premium or the tax does not depend on your health. The mechanics differ. A Swede is covered by a region, a German by a sickness fund, a Dutchman by a private insurer he was obliged to choose, a Japanese worker by his employer’s society. The result is the same: nobody in those thirteen countries walks into a hospital wondering whether they are covered. [1]
The fourteenth answers “it depends.” It depends on your employer, your age, your income, your state, and this year’s plan documents. Two-thirds of Americans hold private coverage and about a third are in a public program, and the two groups overlap and change every year. [7] The nurse in Brisbane did not have a policy view about this. She simply could not understand why a country that could build the pump she was standing next to had not settled the question.
Question three: how good is it?
This is where the American reader expects to win, and on one measure he does. The care is excellent for the people who reach it. Anyone who has watched an American ICU work knows that, and the international evidence is not shy about it either. The OECD’s PaRIS survey of 107,011 primary-care patients in nineteen systems put American respondents at 94 percent reporting good, experienced quality, near the top, and 65 percent trusting the system, above the nineteen-system average. The catch is in the sample: the American respondents were Medicare beneficiaries aged 65 and over, which is to say the one group of Americans with guaranteed coverage. The report adds, without editorial comment, that the US spends more than double per person what some countries with comparable scores spend. [8]
Take the whole population and the picture changes. The Commonwealth Fund’s Mirror, Mirror 2024 compared ten rich countries on access, equity, administrative efficiency, care process and outcomes. Australia came first, the Netherlands second, the United Kingdom third. The United States came tenth, and on administrative efficiency it shared last place with Switzerland. [9] Ipsos asks thirty countries every year whether the care “you and your family have access to” is good. In 2025 the thirty-country average was 43 percent. Australia said 64. Britain said 54, down from 73 seven years earlier, which is the largest collapse in the table and a story for another issue. Ireland said 44. [10] Satisfaction and survival turn out to be different things, and I will show you the survival numbers next.
Question four: what comes out the other end?
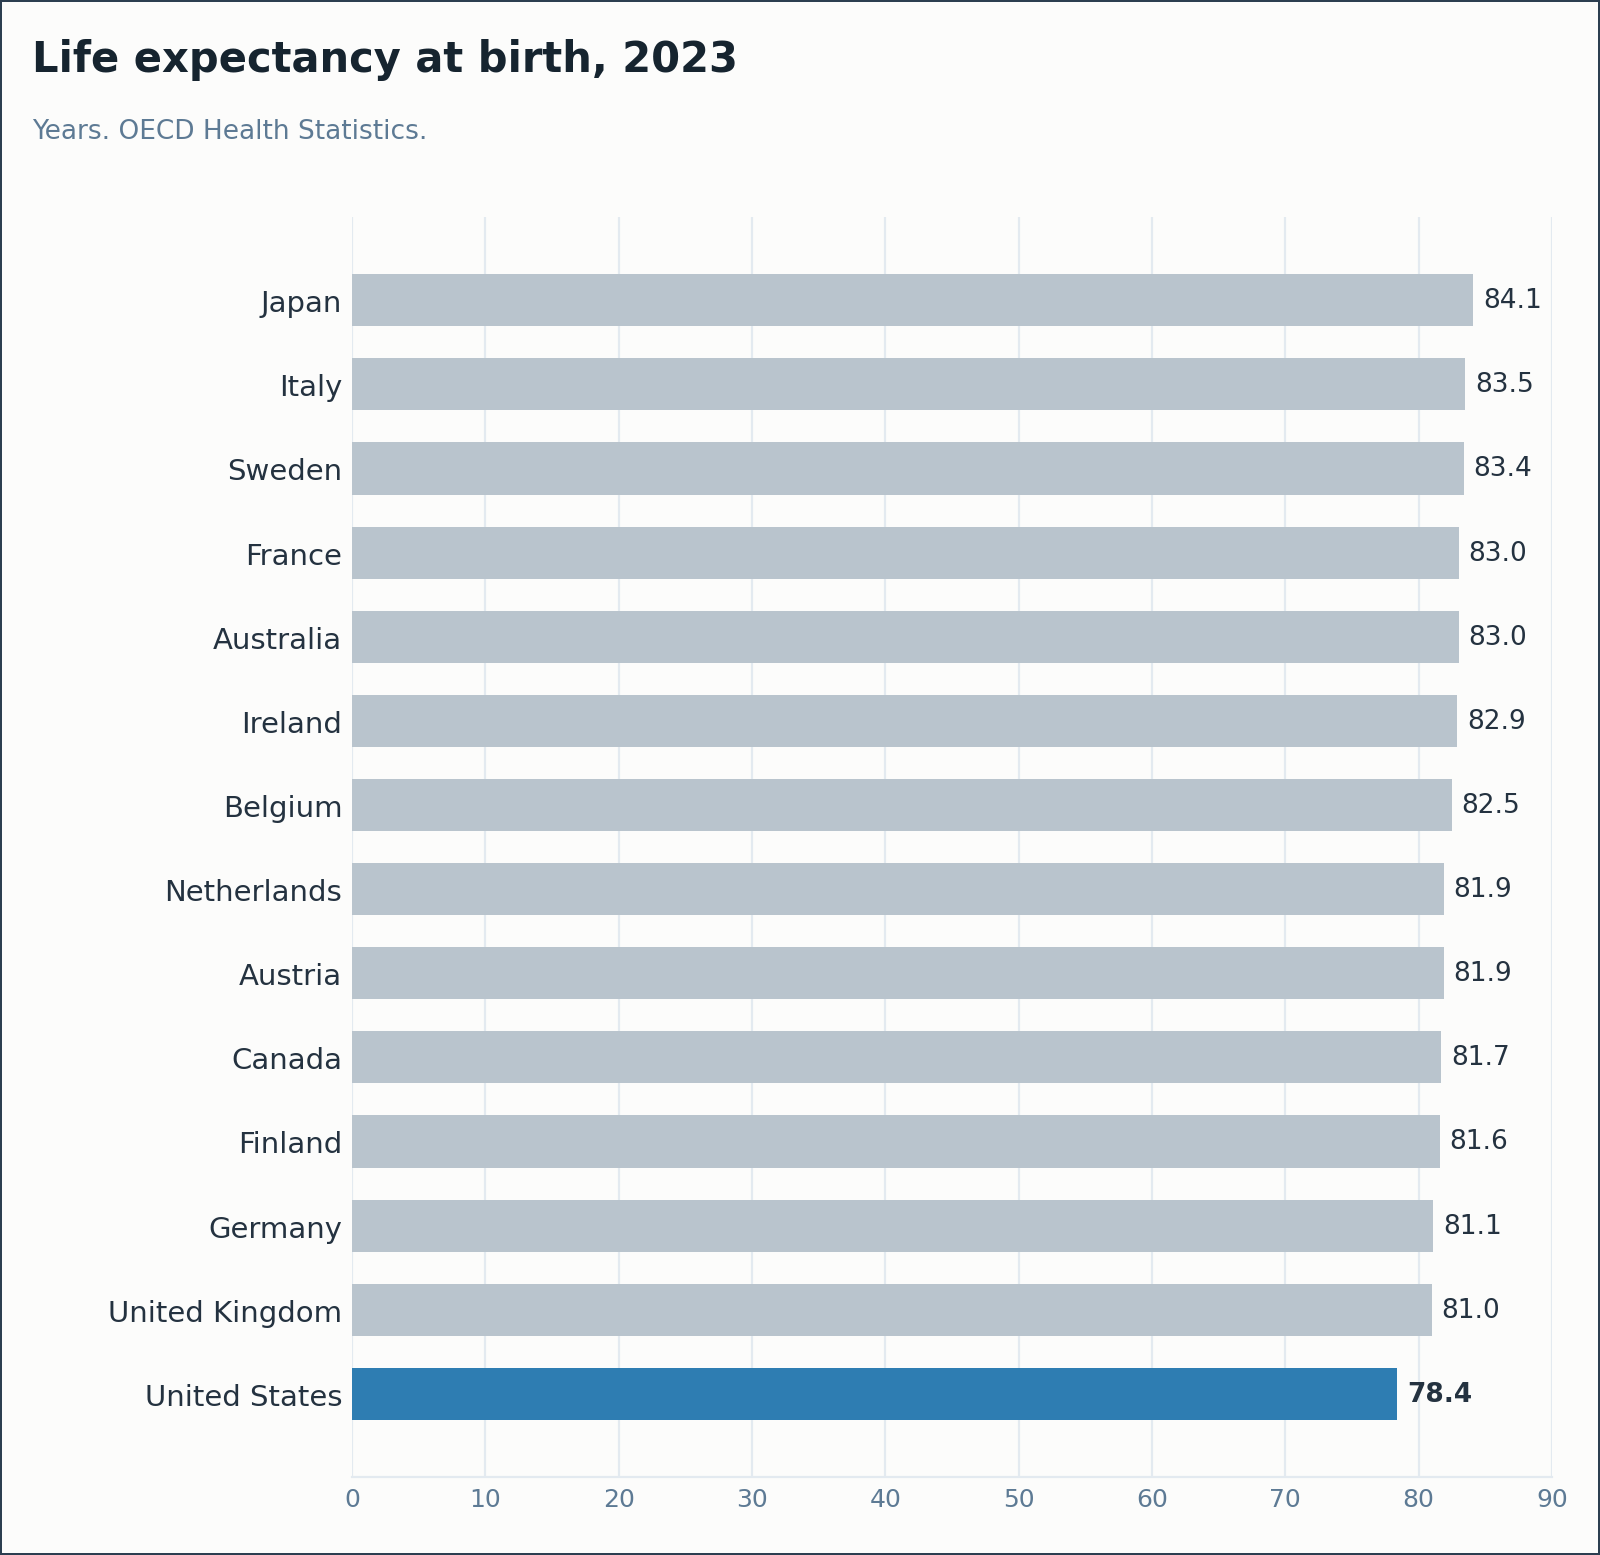
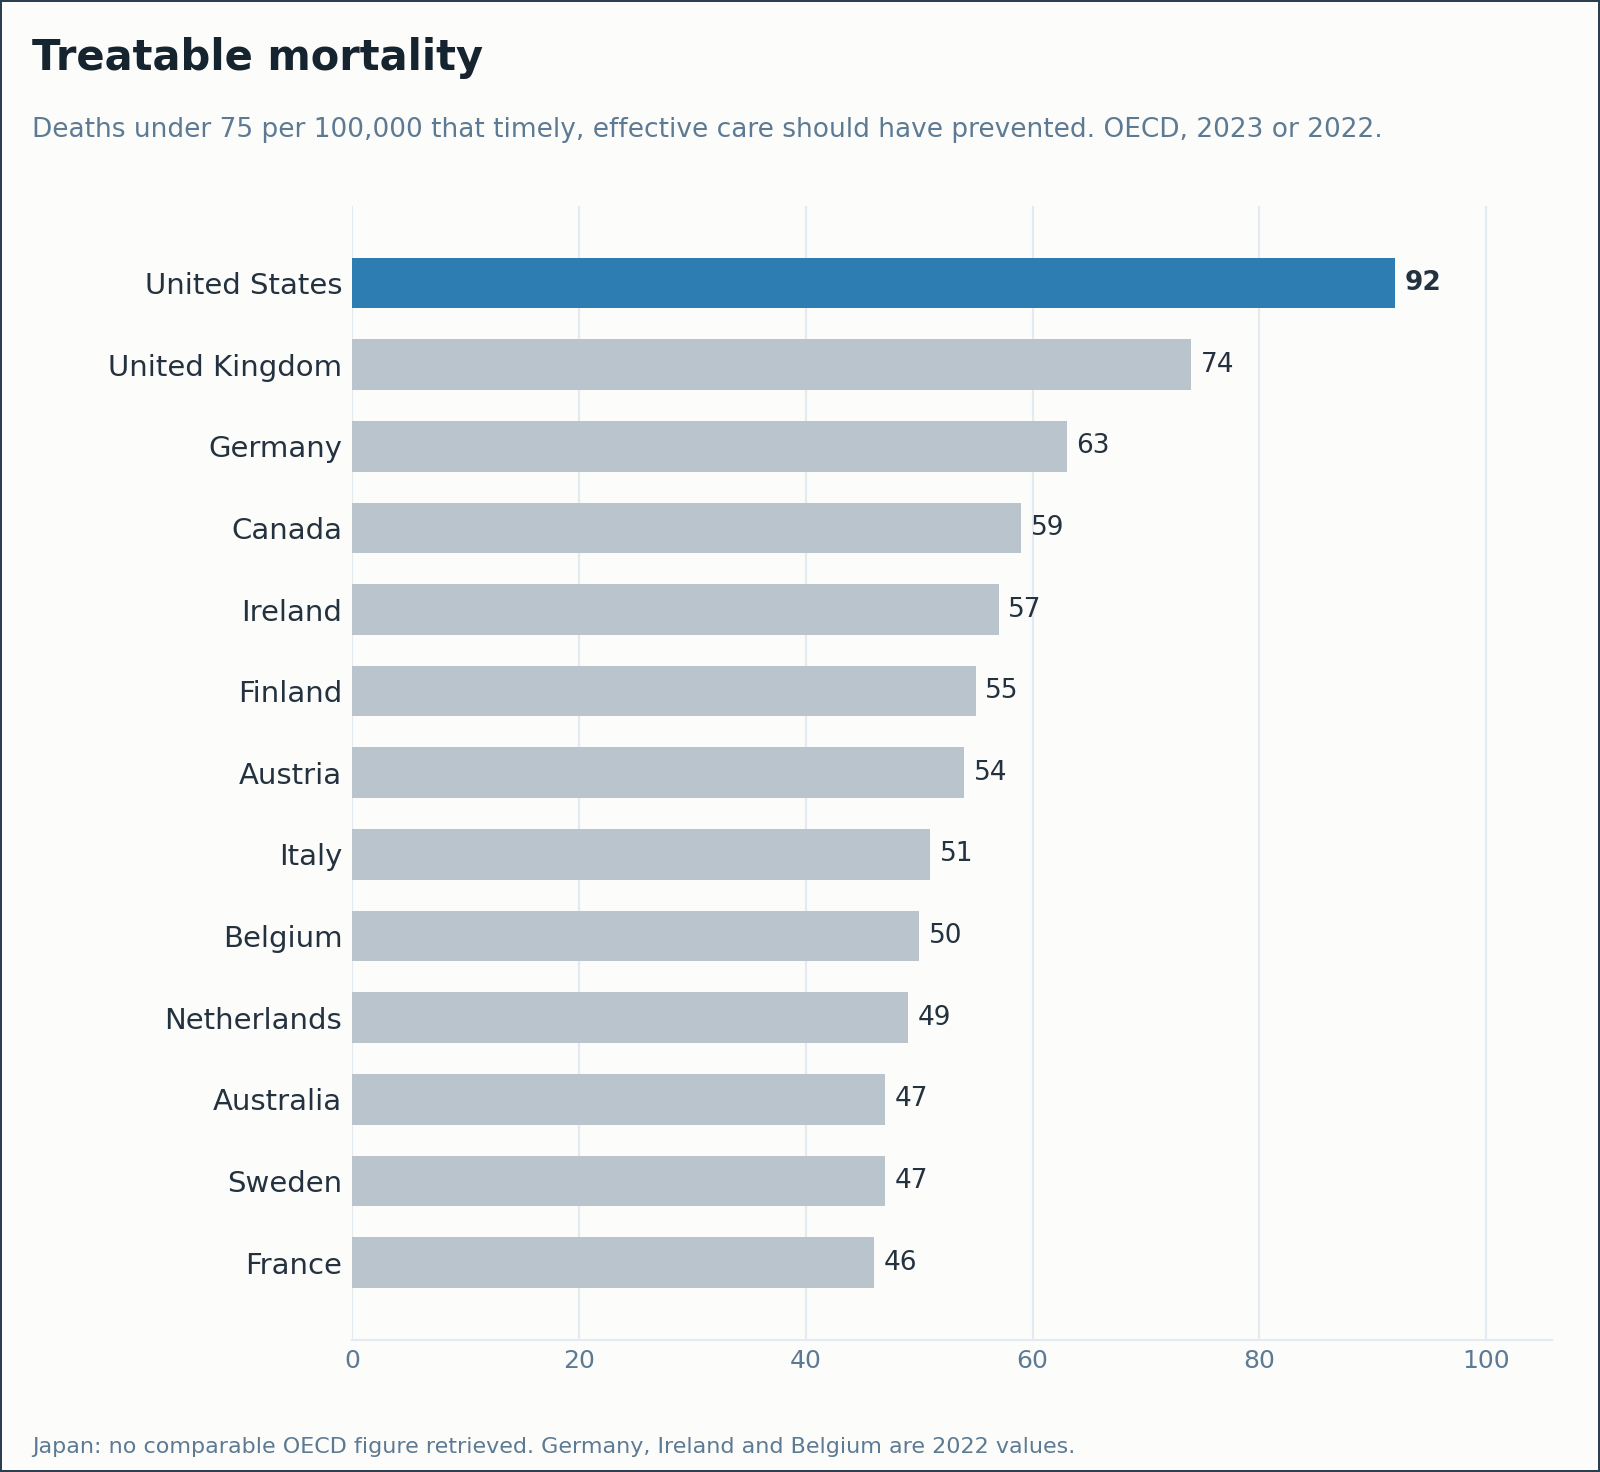
Two measures, and they say the same thing from opposite directions. On life expectancy at birth the United States, at 78.4 years, is between two and a half and six years behind everyone else on the list. [3] On treatable mortality, which counts deaths under 75 that timely and effective care should have prevented, the US loses 92 people per 100,000 against 74 in the United Kingdom, 63 in Germany and 46 in France. That is between 18 and 46 more deaths per 100,000 every year than a country that spends half as much. [3]
There is no standardized cross-country readmission indicator; every country defines the window and the denominator differently, and anyone who has run a readmission program knows the rate is a definition before it is an outcome. For the record, the US all-payer 30-day all-cause rate was 14.0 per 100 admissions in 2020, 17.0 for Medicare and 8.7 for the privately insured. [11] Make of that gap what you will.
One more thing the data refuse to do: sort the systems by ideology. Length of stay does not line up with public versus private. It lines up with bed supply and discharge culture, and Japan proves it. The most beds, the longest stays, an average of 25.6 days across all beds because Japanese hospitals double as long-term care, [12] the longest lives, and the second lowest spending on the list. [3] If more money and shorter stays bought outcomes, Japan would be the sick man of the group. It is the opposite.
The room was the same in fourteen countries
Now the part I did not expect when I started writing this down.
The mechanics of buying a piece of equipment differ from country to country, and they matter for how the money arrives. In the United States about 98 percent of hospitals buy through group purchasing organizations, typically two to four of them, then the deal goes through the system’s capital committee and a value analysis committee, in private, one health system at a time. [13] In the European countries on this list any public hospital purchase above about EUR 216,000 ($248,000) goes to open tender under the EU procurement directive, and the buyer is usually a region or a national purchasing body: the 21 Swedish regions, France’s UniHA buying EUR 7.7 billion ($8.8 billion) a year for 1,550 hospitals, NHS Supply Chain in England. [14] Japan is its own animal. The ministry sets a national fee schedule, repriced every two years from a survey of what hospitals actually paid, so the price of a device category is a matter of public record before the salesman arrives. [15] Someone, in every one of those thirteen countries, has the authority to say no to a price on behalf of a great many beds at once. And when they decide to say no, they mean it: two Swedish regions have just walked away from an American electronic record after spending SEK 7.3 billion ($740 million) between them. [16]
And none of that changed who was in the room. In every one of these fourteen countries the people who decided whether my equipment came in were the same four: a nurse, a biomedical engineer, someone from IT, and an administrator holding a budget that was never big enough. The clinicians had a powerful say everywhere. The departmental silos existed everywhere. The budget strain was the same shape everywhere, whether the money came from a region, a sickness fund, a ministry fee schedule or a GPO contract. The pitch was the same. The questions were the same. The arguments between nursing and IT were, word for word, the same. What differed was how many signatures the money needed and how long it took to arrive.
I had assumed, for most of my career, that the American system produced a different kind of customer. It does not. It produces the same customer with a worse deal.
Who gets to keep the difference
Every country on this list has insurers, and most of them make insurance compulsory. What differs is whether the insurer may keep the difference between what it collects and what it pays out, and what it may pay the person who runs it.
Germany’s statutory sickness funds are public-law bodies and may not make a profit. The chief executive of the largest one, Techniker Krankenkasse, was paid EUR 409,875 ($470,000) in 2025, and it made the newspapers because it was the first time the figure had passed EUR 400,000. [17] The Netherlands caps health-insurer executive pay by statute at EUR 327,000 ($375,000) for 2025, rising to EUR 366,000 ($419,000) this year; its largest insurer reports spending 98 percent of the basic premium on care. [18] Swiss basic insurance must be run without profit, and the two largest insurers paid their chief executives just under CHF 1 million ($1.2 million) each, which the Swiss federal government thinks is too much; it proposed in August to cap the job at a cabinet minister’s salary. [19] Australia’s largest private insurer, Medibank, is a listed company and made A$500.8 million ($357 million) last year; Britain’s Bupa has no shareholders and reinvests what it earns. [20]
Now the United States, 2025, from the companies’ own filings and the proxy statements they filed this spring. UnitedHealth Group, revenue $447.6 billion, net income $12.1 billion, chief executive paid $60.9 million, of which $60 million was a one-time option award on his return to the job. CVS Health, the owner of Aetna, revenue $402.1 billion, net income $1.8 billion, chief executive $21.2 million. Cigna, revenue $274.9 billion, net income $6.0 billion, chief executive $22.9 million. Elevance, revenue $199.1 billion, net income $5.7 billion, chief executive $22.6 million. [21]
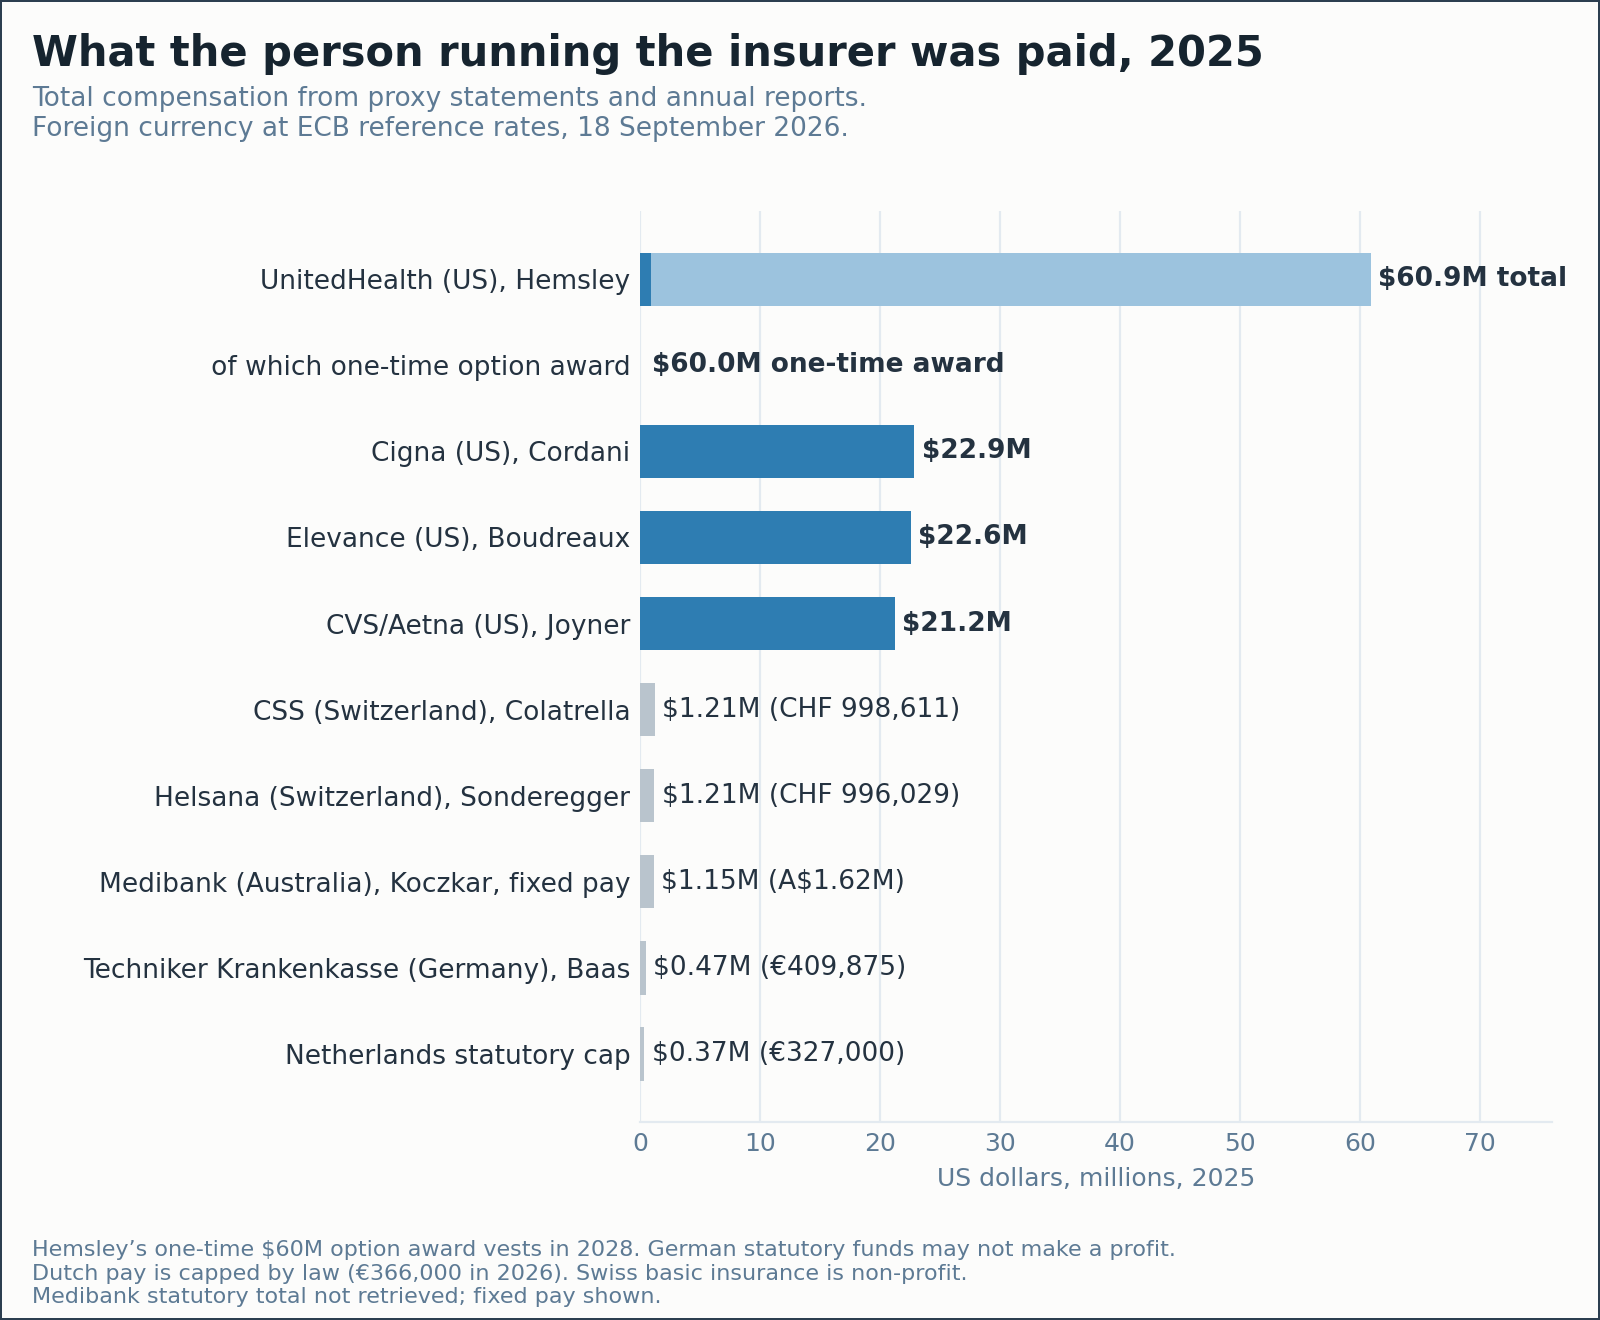
Add it up and the four largest American health insurers took in $1.32 trillion in 2025, roughly 4 percent of everything the country produced, [22] passing through four companies on the way to a bedside. To be fair about the denominator, a large share of that is pharmacy and services business at CVS and at UnitedHealth’s Optum rather than premium, which is its own story about what an American insurer has become. The point is not that anyone broke a rule. It is that the other thirteen countries wrote one, and we did not.
Those four companies earned $25.6 billion of net income between them in 2025 and paid their chief executives about $127 million. Spread over 340 million Americans, [23] that is about $75 a head in profit and under 40 cents a head in executive pay, out of $15,474 a head in health spending. [2] Said that way it sounds like nothing, and an opponent will say it that way. The profit is the visible tip. The paperwork is the iceberg
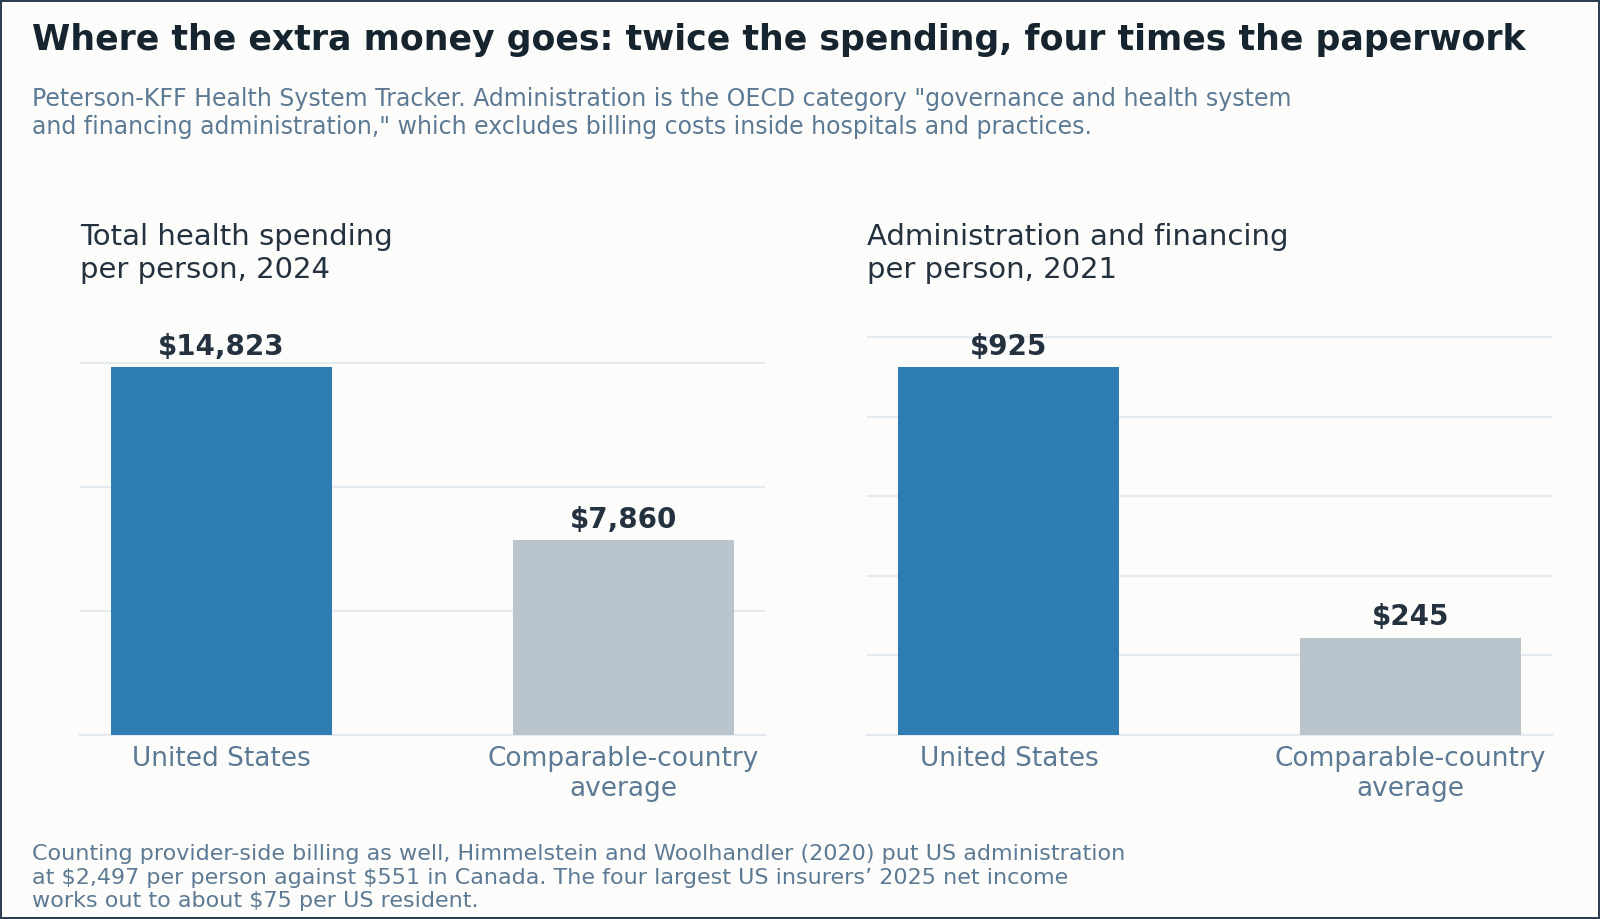
On the narrow OECD definition, the cost of governing and administering the financing of health care, the United States spends 7.6 percent of its health dollars against 3.8 percent in comparable countries: $925 per person against $245. [24] Count what hospitals and doctors spend on billing as well, as Himmelstein and Woolhandler did, and American administration reaches 34 percent of health spending, $2,497 per person, against $551 in Canada. [25] Take whichever definition you like. The gap is $680 to about $1,900 for every man, woman and child, every year, and it is the one line in the budget where we buy nothing at all. Not a nurse, not a bed, not a year of anyone’s life. The insurer profit is what the system pays its owners. The administrative gap is what it pays to keep several thousand hospitals and several hundred insurers negotiating with each other, alone, one contract at a time.
And then there is the hospital
The insurer is the easy villain. The hospital is the harder one, because the hospital is where the care happens, and because an American hospital can be owned by investors and most people never notice. Of 5,121 community hospitals in the United States, 1,224 are investor-owned. Roughly one in four. [26]
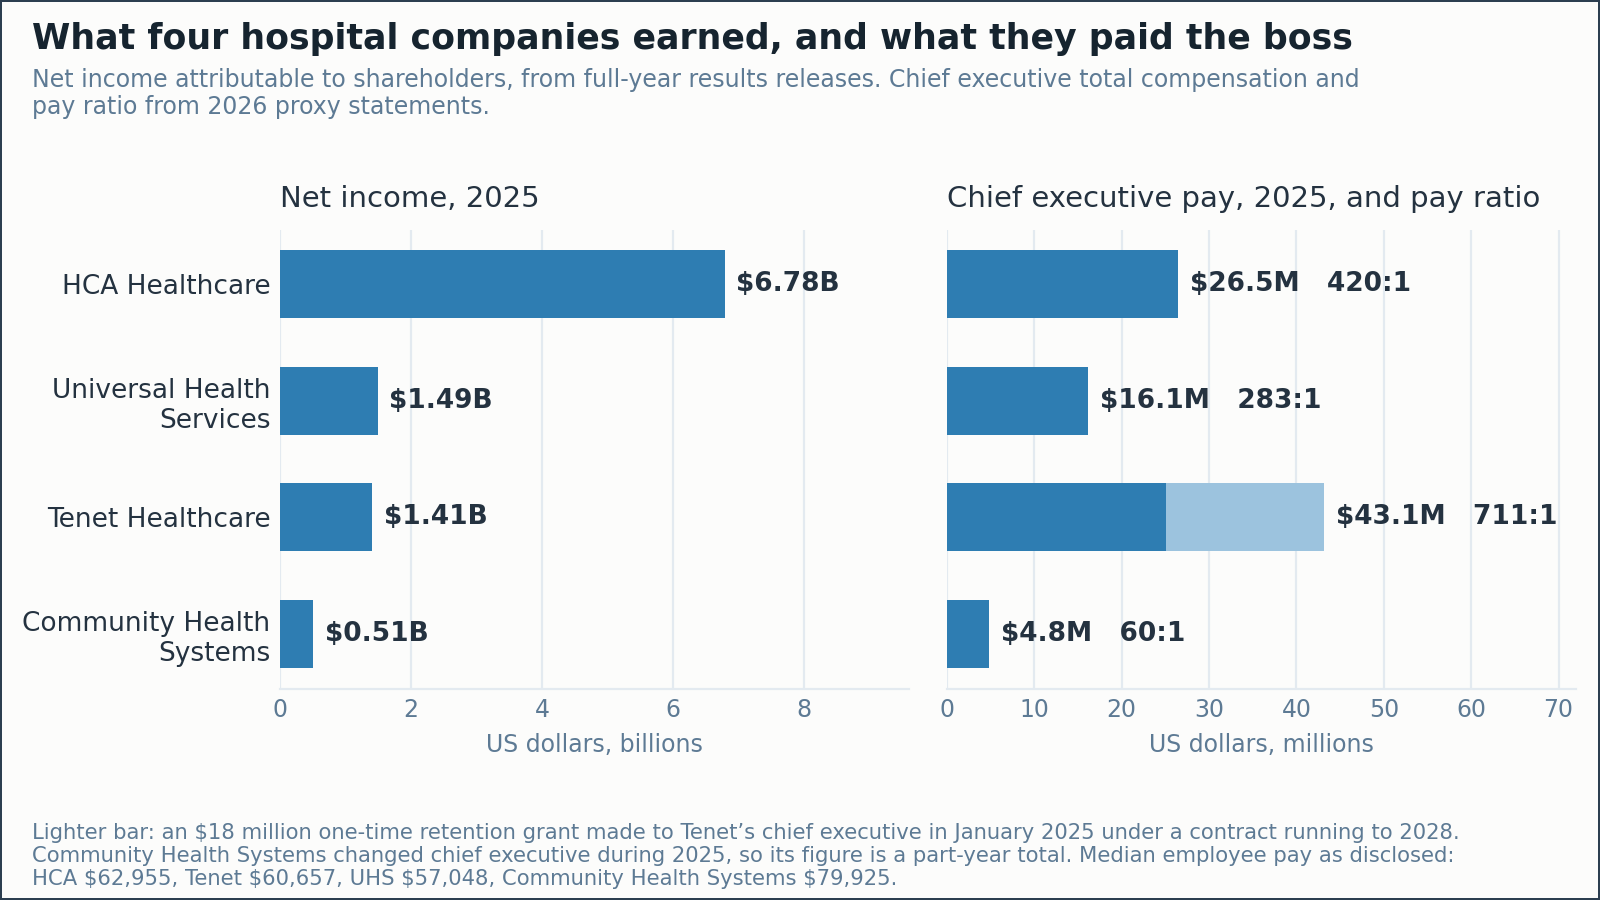
Four of them are public companies and must file their numbers. In 2025, HCA Healthcare took in $75.6 billion and earned $6.784 billion. [27] Tenet Healthcare took in $21.3 billion and earned $1.407 billion. [28] Universal Health Services took in $17.4 billion and earned $1.489 billion. [29] Community Health Systems took in $12.5 billion and earned $509 million. [30] Together: $126.8 billion of revenue and $10.2 billion of profit, a net margin of about 8 percent. For a hospital, 8 percent is a very good year. For a business, it is unremarkable. Hold that thought.
The pay is less unremarkable. Tenet paid Saum Sutaria $43.1 million, of which $18 million was a one-time retention grant made in January 2025 under a contract that runs to 2028. HCA paid Sam Hazen $26.5 million. Universal Health Services paid Marc Miller $16.1 million. Community Health Systems paid Kevin Hammons $4.8 million, and he became chief executive partway through the year, so that is a part-year figure. Each company also must disclose what its median employee made, and the ratio between the two. Tenet: median $60,657, ratio 711 to 1. HCA: median $62,955, ratio 420 to 1. Universal Health Services: median $57,048, ratio 283 to 1. [31]
Read those medians again, because they are the people I have spent this whole issue describing. Sixty thousand dollars a year is the middle of the workforce at a company whose chief executive cleared forty-three million.
Now the same honest arithmetic I ran on the insurers, because it cuts the same way. Ten point two billion dollars of hospital profit, spread over 340 million Americans, [23] is about $30 a head. The four chief executives together cost about 27 cents a head. Add the insurers from the last section and you get roughly $105 per American per year in corporate profit and executive pay, out of $15,474 in health spending. [2] Under one percent. Anyone who tells you that eliminating corporate profit fixes American health care is selling something, and I am not going to help them sell it.
But here is the number the per-person arithmetic hides, and it is the one I would put in front of a hospital board. In 2025 HCA spent $10.067 billion buying back its own shares and paid another $679 million in dividends. That is $10.7 billion returned to shareholders in a year the company earned $6.8 billion. [27] The size of the profit is not the story. What the profit is for is the story. It did not become a nurse, a bed, or a night shift that was fully staffed. It became a smaller share count.
And before anyone reaches for the obvious conclusion, the profit motive is not the American disease. Germany, which beat us on every outcome in the table, has a larger share of its hospitals in private for-profit hands than we do: 729 of 1,807, four in ten, though they hold only 21 percent of the beds because they tend to be smaller. [32] German investors own German hospitals and expect a return, same as here. The difference is what they are allowed to charge. German hospital payment runs on a DRG system that applies to all hospitals irrespective of ownership, at a base rate negotiated for the whole state. [33] A for-profit hospital in Bavaria bills what the public hospital across town bills. It competes on cost, not on price. An American hospital charges what it can negotiate, and RAND found private plans paying 254 percent of Medicare rates in 2022. [34]
The question is not whether a hospital may earn a profit. Thirteen countries on this list say it may. The question is who sets the price it earns that profit on. In thirteen countries that is a public decision, made once, for everybody. Here it is a private negotiation, and the hospital has the better lawyers.
What the nurse knew
The clean version of the American argument is “social medicine versus free enterprise.” Fourteen rows do not support that frame. The US taxpayer already funds the most expensive public health system on earth; the market sits on top of it. Germany, Austria, Belgium, France, Japan and the Netherlands are not tax-funded, and the Netherlands is private insurance all the way down, yet all six land in the middle on cost and at or near the top on outcomes. Ireland and Australia run two-tier systems with roughly half the population holding private cover, and Australia ranks first of the ten in Mirror.
The line that separates the thirteen from the one is not public versus private, and it is not taxes versus premiums. It is two sentences long. Everyone is enrolled, by law, before they get sick. And somebody has the authority to say no to a price. The other thirteen also wrote rules about who may profit, on the premium and on the bed, and about what the people running those businesses may be paid. We did not, and the difference shows up as a doubling of administrative cost and an executive pay band that no other country on the list would recognize.
And the room was the same in all fourteen. That is the part that took me forty years to notice and a nurse in Brisbane one sentence to say. The nurses, the biomeds, the IT people and the administrators wanted the same things, asked the same questions, fought the same silos and ran out of the same money. The technology traveled fine. The idea that care is a right did not make the return trip.
She was right. It is nuts. And it is the most expensive nuts in the world.
About the author
Daniel Pettus spent forty years in medical device and health IT leadership at Alaris, CareFusion and BD, contributed to IHE Patient Care Device interoperability standards, and is named on two United States patents. He writes Inside the Loop at insidetheloopdp.substack.com.
The serious version of the day job is a book. The Technology Was Never the Problem: forty years of trying to connect medical devices, what stopped it, and why the answer was never engineering. Paperback and ebook at pettusbook.com.
AI MedAgent is a research demonstration of a patent-pending method. Advisory only. Not a medical device. Not for clinical use. Simulated patients, synthetic data only. aimedagent.net
Reference Notes provided on request